
Provisional CBAM Calculation Values Pass Committee Vote
The European Commission’s Carbon Border Adjustment Mechanism (CBAM) Committee has accepted the final versions of technical implementing acts core to calculating CBAM costs, laying vital foundations for the instrument’s definitive and fiscally-liable stage, from January.
Following a series of revisions, the implementing acts – which outline the technical application of CBAM benchmarks and default values – have passed the comitology process with sufficient member state votes, and are now expected to be officially presented for adoption before end of year. Despite formal recognition, these calculation values still exist on a provisional basis, and will see further review post-adoption as CBAM proceeds through its definitive stage.
McCloskey exclusively broke details on CBAM’s core calculation values back in November, which detailed the higher-than-expected costs potentially faced by EU importers, when calculating CBAM liabilities from default values. Since then, this “worst-case scenario” faced by steel importers has – if anything – gotten even worse. Default values have been increased for a number of origins (such as China), and benchmark values have been revised downward. CBAM benchmarks have been decreased to account for projected adjustments to underlying Emissions Trading System (ETS) benchmarks 2026-2030, with further reductions to direct-reduced iron (DRI) related values.
For example, McCloskey learned of a fresh deal for a full vessel (40-50kt) of Indian-origin carbon hot-rolled coil (HRC) to a single Italian buyer at the dollar equivalent of around EUR430/t CFR Italy, 10 December, that if declared on default emissions values, would incur a per ton CBAM cost of EUR270/t. The CBAM-liability totals to almost EUR13.5m across the full (50kt) shipment.
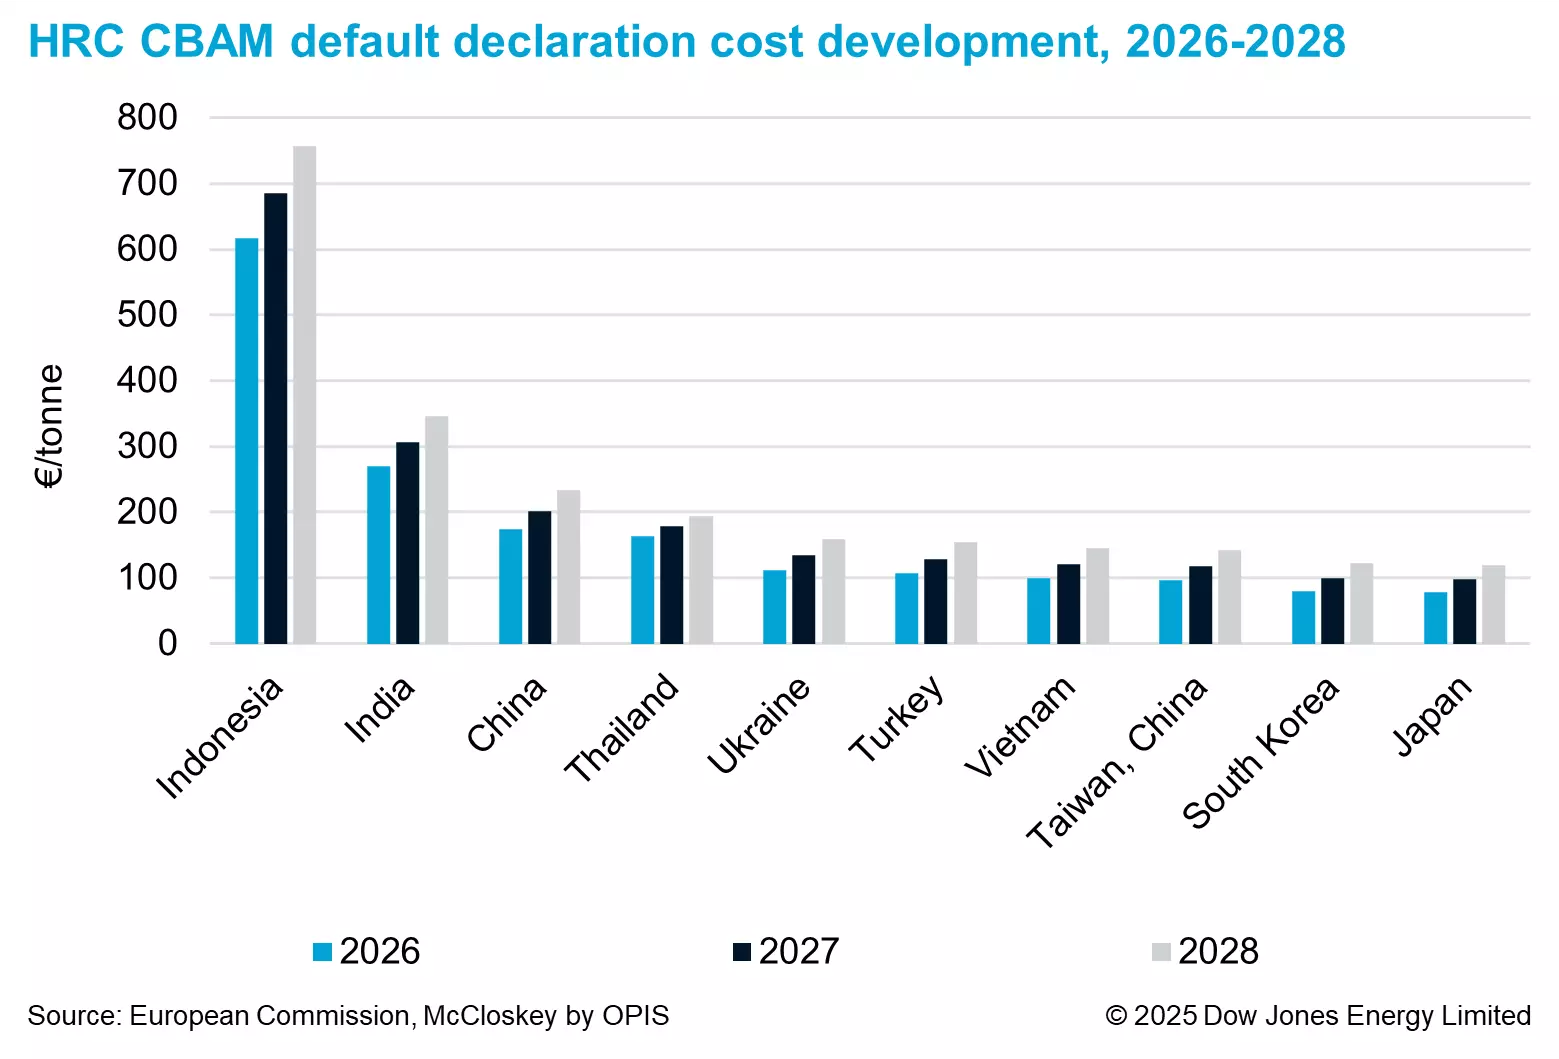
McCloskey has calculated potential CBAM costs for a range of product categories with a custom model, as initially demonstrated for imports of carbon HRC across core origins:
CBAM declarations and calculations
CBAM is best thought of as a mirror of the EU ETS, imposing carbon costs at the border in line with what a third country installation would pay if operating domestically in the EU.
Simplified formulae for calculating CBAM’s additional import costs are below:
CBAM-liable Emissions = Total Embedded Emissions – Free Allocation Adjustment – Carbon Price Already Paid
Free Allocation Adjustment = Specific Embedded Free Allocation × Mass
Specific Embedded Free Allocation = CBAM factor × Cross-Sectoral Correction Factor × CBAM Benchmark
Carbon Price Already Paid
Little is yet known about how any Carbon Price Already Paid will be recognised and accounted for in the CBAM framework, though the European Commission has committed to publishing ‘default’ carbon price deductions for respective origins later in the definitive stage.
Cross-Sectoral Correction Factor (CSCF)
The CSCF reduces free allocations uniformly across the ETS where demand exceeds supply, but is not yet known for the 2026-2030 period. The CSCF was previously set at 100% for 2021-2025.
Free Allocation Adjustment
The ‘Free Allocation Adjustment’ is a deduction to balance CBAM liabilities against ‘free allowances’ received by domestic producers via the ETS, and is calculated in reference to specifically designed CBAM benchmarks. CBAM benchmarks are themselves derived from ETS benchmarks, and are multiplied by a ‘CBAM factor’ that increases CBAM liabilities as ETS free allocations are phased-out at an increasing rate between 2026-2034. The CBAM factor starts at 97.5% in 2026.
CBAM factor/Default Value Mark-up Timeline
| Year | CBAM Factor | Default Value Mark-up |
|---|---|---|
| 2026 | 0.975 | 10% |
| 2027 | 0.95 | 20% |
| 2028 | 0.9 | 30% |
| 2029 | 0.775 | 30% |
| ‘Actual’ vs ‘Default’ Benchmarks |
Table © 2025 Oil Price Information Service, LLC. or © 2025 Dow Jones Energy Limited. All rights reserved.
CBAM’s benchmarks are split between ‘actual’ and ‘default’ listings. Default benchmarks in particular are then further split by production route, in recognition of the independent emissions profiles of blast furnace-basic oxygen furnace (BF-BOF); direct-reduced iron to electric arc furnace (DRI-EAF); and scrap to electric-arc-furnace steelmaking (scrap-EAF). Some ‘actual’ benchmarks, namely those relating to semi-finished steel products, are also split by production route.
Despite this split, the vast majority of origins have been assigned benchmark classifications of BF-BOF for their steel products, meaning they must use BF-BOF route benchmarks when calculating CBAM costs on default values, regardless of the actual production route of the import. To calculate CBAM liabilities with data corresponding to the actual production route, ‘actual’ emission data and benchmarks must be used.
Default Benchmark Production Route Designation by Origin
| Origins | BM Prod. Route Classification |
|---|---|
| Algeria | Blast Furnace-Basic Oxygen Furnace |
| Argentina | Blast Furnace-Basic Oxygen Furnace |
| Australia | Blast Furnace-Basic Oxygen Furnace |
| Azerbaijan | Scrap-EAF |
| Bosnia_Herzegovina | Blast Furnace-Basic Oxygen Furnace |
| Brazil | Blast Furnace-Basic Oxygen Furnace |
| Canada | Blast Furnace-Basic Oxygen Furnace |
| Chile | Blast Furnace-Basic Oxygen Furnace |
| China | Blast Furnace-Basic Oxygen Furnace |
| Colombia | Blast Furnace-Basic Oxygen Furnace |
| India | Blast Furnace-Basic Oxygen Furnace |
| Indonesia | Blast Furnace-Basic Oxygen Furnace |
| Iran | Blast Furnace-Basic Oxygen Furnace |
| Japan | Blast Furnace-Basic Oxygen Furnace |
| Kazakhstan | Blast Furnace-Basic Oxygen Furnace |
| Mexico | Blast Furnace-Basic Oxygen Furnace |
| Myanmar_Burma | Scrap-EAF |
| New_Zealand | Blast Furnace-Basic Oxygen Furnace |
| North_Macedonia | Blast Furnace-Basic Oxygen Furnace |
| Philippines | Scrap-EAF |
| Russia | Blast Furnace-Basic Oxygen Furnace |
| Serbia | Blast Furnace-Basic Oxygen Furnace |
| South_Africa | Blast Furnace-Basic Oxygen Furnace |
| South_Korea | Blast Furnace-Basic Oxygen Furnace |
| Taiwan_China | Blast Furnace-Basic Oxygen Furnace |
| Thailand | Scrap-EAF |
| Turkey | Blast Furnace-Basic Oxygen Furnace |
| Ukraine | Blast Furnace-Basic Oxygen Furnace |
| United_Kingdom | Blast Furnace-Basic Oxygen Furnace |
| United_States | Blast Furnace-Basic Oxygen Furnace |
| Uzbekistan | Scrap-EAF |
| Vietnam | Blast Furnace-Basic Oxygen Furnace |
| Other_Origins | Blast Furnace-Basic Oxygen Furnace |
Table Source: McCloskey by OPIS © 2025 Oil Price Information Service, LLC. or © 2025 Dow Jones Energy Limited. All rights reserved.
CBAM calculation methodologies
There are essentially three ways to declare CBAM liabilities when certificates are surrendered in September 2027:
Actual Values
Importers can calculate their imported embedded emissions using ‘actual’ values and benchmarks – provided by and specific to each exporting installation’s production process. This requires calculating the emissions liability for each process and precursor recursively up the production chain, and can quickly become sophisticated, especially given the complexity of steel goods.
‘Actual’ CBAM benchmarks are thus generally lower than ‘default’ benchmarks for the same CN code, as they do not account for embedded upstream emissions, which must be separately calculated and combined to derive the total emissions liability.
Default Values
Where emissions data is not available, or cannot be verified, importers must resort to ‘default’ values and benchmarks. These values make assumptions as to the carbon embedded in an origin’s steel products, and include a punitive element to incentivise the disclosure and use of actual values. The Commission has introduced a gradual phase-in for the punitive mark-up of steel products, starting at 10% in 2026; then 20% in 2027; and at 30% from 2028.
The Commission has committed to revise the default values and mark-ups “by December 2027 at the latest,” though “all necessary efforts” will be made such that a revision “can already be carried out in 2026.”
Mixed Values
If some precursors cannot be verified, then a mixed methodology can be used, assigning actual values downstream in the production process and using default values for some precursors. Where a default value is used, actual values cannot be used for upstream precursors connected to that default value, as their emissions have already been assumed.
In the finalised implementing acts, a new annex of provisional default values has been introduced for precursors for which the origin cannot be identified – most relevant to mixed values declarations. These defaults adopt the highest available value for each product listing across other origins, before applying the same 10-30% phased mark-up.
‘Actual’ and ‘default’ CBAM benchmarks for core steel products are illustrated in the table below.
CBAM Benchmarks, ‘Actual’ and ‘Default’
| Steel Product | Actual Values BM (2026) (t CO2e/t) – No Split | Actual – BF-BOF | Actual – DRI-EAF | Actual – Scrap-EAF | Default Values BM (2026) (t CO2e/t) – No Split | Default – BF-BOF | Default – DRI-EAF | Default – Scrap-EAF |
|---|---|---|---|---|---|---|---|---|
| Iron Ore | 0.086 | 0.086 | ||||||
| Pig Iron | 1.089 | 1.21 | ||||||
| DRI | 0.295 | 0.397 | ||||||
| Ferro-manganese | 1.361 | 1.361 | ||||||
| Ferro-chromium | 1.142 | 1.142 | ||||||
| Ferro-nickel | 2.39 | 2.39 | ||||||
| Semifinished | 0.188 | 0.065 | 0.065 | 1.364 | 0.475 | 0.066 | ||
| HRC | 0.044 | 1.37 | 0.481 | 0.072 | ||||
| CRC | 0.079 | 1.458 | 0.533 | 0.108 | ||||
| HDG | 0.112 | 1.491 | 0.567 | 0.141 | ||||
| Heavy Plate | 0.044 | 1.37 | 0.481 | 0.072 | ||||
| Rebar | 0.038 | 1.364 | 0.475 | 0.066 | ||||
| Wire Rod | 0.038 | 1.364 | 0.475 | 0.066 | ||||
| Heavy Sections | 0.038 | 1.364 | 0.475 | 0.066 | ||||
| Stainless HR | 0.109 | 1.189 | ||||||
| Stainless Longs | 0.109 | 1.225 |
Table Source: McCloskey by OPIS © 2025 Oil Price Information Service, LLC. or © 2025 Dow Jones Energy Limited. All rights reserved.
Actual Values – Verification
Verification rules – compliance with which is necessary for CBAM declarations on ‘actual’ values – were released earlier in November, essentially imposing strict ETS-level criteria for third country installations to account, process, and subsequently verify their emissions data.
Verifications will commence from 2027, requiring emissions data averaged across calendar year 2026, meaning accredited verifiers cannot conduct necessary site visits or substantive verification activities until 2026 concludes.
The latest CBAM rules set 2026 as the minimum reporting period for CBAM declarations, so even material produced in 2025, and imported in 2026 will have to reference calendar year 2026 emissions data.
In light of this requirement, McCloskey has discussed the steel trade’s verification-readiness with a number of verifiers or related entities across Europe, Asia, and South America – all of which evidence a common theme: uncertainty.
Verification readiness
While importers are generally satisfied that larger or more modernised suppliers should be able to meet emissions data requirements when verification activities commence from 2027, both the capacities of accreditation bodies, and verifiers, as well as the willingness of third country installations to subject themselves to foreign scrutiny, are potential concerns that could see importers pushed onto default values.
“[National Accreditation Bodies] are already at high-capacity, so I really doubt they are going to start accrediting third-country verifiers on-mass,” said an EU accredited ETS verifier. “Not only that, but what does this look like in practice? The reality of accessing and inspecting a plant from the ground can be difficult, opaque, and subject to resistance from personnel – I’m not sure this will all go as smoothly as the Commission hopes.”
A Chinese emissions and CBAM consultant agreed, stating that foreign verifiers may be unable to identify circumvention tactics once on-site, undermining physical visitation requirements. Chinese companies could also fall foul of China’s strict security frameworks if offering unrestricted physical or digital access to foreign verifiers.
More generally, the consultant considered that “data preparedness is not defined by a country’s size or level of development. It boils down to the willingness of the specific factory to collect and calculate said data.”
According to Mexican sustainability consultancy Sustainluum – “for many global companies, especially leaders in the […] steel sectors, this type of process is not unfamiliar. They have long been accustomed to receiving on-site audits, submitting their data to independent review, and working under formal emission measurement and reporting schemes. They have also developed exercises like EPDs (Environmental Product Declarations), which require a level of traceability and methodological coherence very close to what CBAM requires.
“This does not mean that the adjustment is automatic. CBAM requires verifiable information per facility, specific calculation methods according to Annex IV, and sufficiently robust traceability to allow external verification. To reach this level, facilities will have to strengthen the quality of their records, standardize factors, improve integration between their operational and environmental areas, and, in general, consolidate a more rigorous monitoring structure that allows the reconstruction of the information used in the calculation of embedded emissions.”
‘Looking behind’ EPDs
Sustainluum rightfully value possession of an EPD, but importantly clarify that EPD status and CBAM verification are not one and the same – an idea McCloskey commonly encounters across the global steel markets.
For example, China’s Iron and Steel Association (CISA) recently celebrated a milestone number of EPDs issued to its domestic steelmakers, with Chinese market participants said to be connecting EPD possession with CBAM-compatibility.
Unfortunately, while an installation’s EPD is good evidence that the required primary emissions data at least exists, the nuance of mapping site-level process emissions to specific product outputs is a particularly complex task, as described by a Turkish consultancy performing carbon accounting services.
“Turkish producers generally have no problem with primary data availability, and as with other exporting origins we incentivised to meet EU requirements due to the high default values for Turkey versus what can be achieved on actual values,” said the consultant.
“It will take some time to adjust to the level of CBAM, however, as many producers can make mistakes when tying direct or indirect emissions to specific products, or properly allocating process emissions. What poses greater difficulty [than data availability] is the expertise required to map emissions to specific processes and products, even before verification activities commence.”
Separately, some European traders have estimated that as many as 80% of imported emissions could be forced onto default values due to verification frictions. This is somewhat evidenced by the lack of actual emissions data collected during the transitional stage, which McCloskey understands motivated the Commission’s original use of public datasets to inform CBAM’s default values.
As such, there is a risk that despite their best efforts, European importers could become subject to worst-case CBAM cost scenarios on default values through verification failures – potentially devastating to an importer’s bottom-line.
Default Values – Calculations
McCloskey has calculated CBAM cost exposure from the finalised provisional default benchmarks and values, referencing dominant origins within each product category on the basis of import data (Global Trade Tracker) for the last year.
Calculated values are presented per ton of steel in the tables below, and assume a CBAM certificate price of EUR80.
Where relevant benchmark or default values overlap within a product category, a proxy CN Code has been selected, as derived values are very often consistent across these CN Codes groupings (e.g. all CN Codes under Heading 7208 list the same default benchmark and value for respective origins).
Iron Ore
| Steel Product | CN Code | Origin | Year | Default Prod. Route | Default BM (t CO2e/t) | Default Value (t CO2e/t) | CBAM cost (EUR/t) |
|---|---|---|---|---|---|---|---|
| Iron Ore | 26011200 | Australia | 2026 | No Split/Hybrid | 0.086 | 0.099 | € 1.21 |
| 26011200 | Canada | 2026 | No Split/Hybrid | 0.086 | 0.099 | € 1.21 | |
| 26011200 | Ukraine | 2026 | No Split/Hybrid | 0.086 | 0.132 | € 3.85 | |
| 26011200 | Brazil | 2026 | No Split/Hybrid | 0.086 | 0.22 | € 10.89 | |
| 26011200 | United_States | 2026 | No Split/Hybrid | 0.086 | 0.748 | € 53.13 | |
| 26011200 | Mexico | 2026 | No Split/Hybrid | 0.086 | 0.143 | € 4.73 | |
| 26011200 | United_Kingdom | 2026 | No Split/Hybrid | 0.086 | 0.308 | € 17.93 |
Table Source: McCloskey by OPIS © 2025 Oil Price Information Service, LLC. or © 2025 Dow Jones Energy Limited. All rights reserved.
Pig Iron
| Steel Product | CN Code | Origin | Year | Default Prod. Route | Default BM (t CO2e/t) | Default Value (t CO2e/t) | CBAM cost (EUR/t) |
|---|---|---|---|---|---|---|---|
| Pig Iron | 72011090 | Brazil | 2026 | No Split/Hybrid | 1.21 | 1.62547 | € 35.66 |
| 72011090 | Canada | 2026 | No Split/Hybrid | 1.21 | 1.221 | € 3.30 | |
| 72011090 | Russia | 2026 | No Split/Hybrid | 1.21 | 3.344 | € 173.14 | |
| 72011090 | South_Africa | 2026 | No Split/Hybrid | 1.21 | 3.817 | € 210.98 | |
| 72011090 | Ukraine | 2026 | No Split/Hybrid | 1.21 | 2.3903 | € 96.84 |
Table Source: McCloskey by OPIS © 2025 Oil Price Information Service, LLC. or © 2025 Dow Jones Energy Limited. All rights reserved.
Direct Reduced Iron
| Steel Product | CN Code | Origin | Year | Default Prod. Route | Default BM (t CO2e/t) | Default Value (t CO2e/t) | CBAM cost (EUR/t) |
|---|---|---|---|---|---|---|---|
| Direct Reduced Iron | 72031000 | Algeria | 2026 | No Split/Hybrid | 0.397 | 0.891 | € 40.31 |
| 72031000 | Canada | 2026 | No Split/Hybrid | 0.397 | 0.836 | € 35.91 | |
| 72031000 | Libya | 2026 | No Split/Hybrid | 0.397 | 1.4575 | € 85.63 | |
| 72031000 | Russia | 2026 | No Split/Hybrid | 0.397 | 2.211 | € 145.91 | |
| 72031000 | United_States | 2026 | No Split/Hybrid | 0.397 | 0.495 | € 8.63 | |
| 72031000 | Venezuela | 2026 | No Split/Hybrid | 0.397 | 1.4575 | € 85.63 |
Table Source: McCloskey by OPIS © 2025 Oil Price Information Service, LLC. or © 2025 Dow Jones Energy Limited. All rights reserved.
Ferroalloys
| Steel Product | CN Code | Origin | Year | Default Prod. Route | Default BM (t CO2e/t) | Default Value (t CO2e/t) | CBAM cost (EUR/t) |
|---|---|---|---|---|---|---|---|
| Ferro-manganese | 72021120 | India | 2026 | No Split/Hybrid | 1.361 | 1.859 | € 42.56 |
| 72021900 | India | 2026 | No Split/Hybrid | 1.361 | 6.149 | € 385.76 | |
| 72021120 | Malaysia | 2026 | No Split/Hybrid | 1.361 | 1.859 | € 42.56 | |
| 72021900 | Malaysia | 2026 | No Split/Hybrid | 1.361 | 6.149 | € 385.76 | |
| 72021120 | South_Africa | 2026 | No Split/Hybrid | 1.361 | 1.859 | € 42.56 | |
| 72021900 | South_Africa | 2026 | No Split/Hybrid | 1.361 | 6.149 | € 385.76 | |
| Ferro-chromium | 72024110 | South_Africa | 2026 | No Split/Hybrid | 1.142 | 2.585 | € 117.72 |
| 72024910 | South_Africa | 2026 | No Split/Hybrid | 1.142 | 3.157 | € 163.48 | |
| 72024110 | Zimbabwe | 2026 | No Split/Hybrid | 1.142 | 2.585 | € 117.72 | |
| 72024910 | Zimbabwe | 2026 | No Split/Hybrid | 1.142 | 3.157 | € 163.48 | |
| 72024110 | Turkey | 2026 | No Split/Hybrid | 1.142 | 2.585 | € 117.72 | |
| 72024910 | Turkey | 2026 | No Split/Hybrid | 1.142 | 3.157 | € 163.48 | |
| Ferro-nickel | 72026000 | Brazil | 2026 | No Split/Hybrid | 2.39 | 3.828 | € 119.82 |
| 72026000 | Indonesia | 2026 | No Split/Hybrid | 2.39 | 6.765 | € 354.78 | |
| 72026000 | Colombia | 2026 | No Split/Hybrid | 2.39 | 3.828 | € 119.82 | |
| 72026000 | New Caledonia | 2026 | No Split/Hybrid | 2.39 | 4.4154 | € 166.81 |
Table Source: McCloskey by OPIS © 2025 Oil Price Information Service, LLC. or © 2025 Dow Jones Energy Limited. All rights reserved.
Semifinished slab/billet
| Steel Product | CN Code | Origin | Year | Default Prod. Route | Default BM (t CO2e/t) | Default Value (t CO2e/t) | CBAM cost (EUR/t) |
|---|---|---|---|---|---|---|---|
| Semifinished slab | 72071210 | Algeria | 2026 | Carbon Steel – BF/BOF | 1.364 | 3.3 | € 157.61 |
| 72071210 | Brazil | 2026 | Carbon Steel – BF/BOF | 1.364 | 1.771 | € 35.29 | |
| 72071210 | China | 2026 | Carbon Steel – BF/BOF | 1.364 | 3.485663842 | € 172.46 | |
| 72071210 | India | 2026 | Carbon Steel – BF/BOF | 1.364 | 4.697 | € 269.37 | |
| 72071210 | Russia | 2026 | Carbon Steel – BF/BOF | 1.364 | 3.531 | € 176.09 | |
| 72071210 | Turkey | 2026 | Carbon Steel – BF/BOF | 1.364 | 2.540638498 | € 96.86 | |
| 72071210 | Ukraine | 2026 | Carbon Steel – BF/BOF | 1.364 | 2.63723394 | € 104.59 | |
| 72071210 | Vietnam | 2026 | Carbon Steel – BF/BOF | 1.364 | 2.585 | € 100.41 |
Table Source: McCloskey by OPIS © 2025 Oil Price Information Service, LLC. or © 2025 Dow Jones Energy Limited. All rights reserved.
Hot-rolled Coil (HRC)/Heavy Plate
| Steel Product | CN Code | Origin | Year | Default Prod. Route | Default BM (t CO2e/t) | Default Value (t CO2e/t) | CBAM cost (EUR/t) |
|---|---|---|---|---|---|---|---|
| HRC/Heavy Plate | 72083900 | Algeria | 2026 | Carbon Steel – BF/BOF | 1.37 | 3.3 | € 157.14 |
| 72083900 | India | 2026 | Carbon Steel – BF/BOF | 1.37 | 4.708 | € 269.78 | |
| 72083900 | Indonesia | 2026 | Carbon Steel – BF/BOF | 1.37 | 9.053 | € 617.38 | |
| 72083900 | Japan | 2026 | Carbon Steel – BF/BOF | 1.37 | 2.31 | € 77.94 | |
| 72083900 | Serbia | 2026 | Carbon Steel – BF/BOF | 1.37 | 2.651 | € 105.22 | |
| 72083900 | South_Korea | 2026 | Carbon Steel – BF/BOF | 1.37 | 2.330323809 | € 79.57 | |
| 72083900 | Taiwan_China | 2026 | Carbon Steel – BF/BOF | 1.37 | 2.54050804 | € 96.38 | |
| 72083900 | Thailand | 2026 | Carbon Steel – Scrap-EAF | 0.072 | 2.11145 | € 163.30 | |
| 72083900 | Turkey | 2026 | Carbon Steel – BF/BOF | 1.37 | 2.670262911 | € 106.76 | |
| 72083900 | Vietnam | 2026 | Carbon Steel – BF/BOF | 1.37 | 2.585 | € 99.94 | |
| 72083900 | Ukraine | 2026 | Carbon Steel – BF/BOF | 1.37 | 2.730942761 | € 111.62 |
Table Source: McCloskey by OPIS © 2025 Oil Price Information Service, LLC. or © 2025 Dow Jones Energy Limited. All rights reserved.
Cold-rolled Coil (CRC)
| Steel Product | CN Code | Origin | Year | Default Prod. Route | Default BM (t CO2e/t) | Default Value (t CO2e/t) | CBAM cost (EUR/t) |
|---|---|---|---|---|---|---|---|
| CRC | 72091690 | Brazil | 2026 | Carbon Steel – BF/BOF | 1.458 | 1.903 | € 38.52 |
| 72091690 | Egypt | 2026 | Carbon Steel – BF/BOF | 1.458 | 4.51055 | € 247.12 | |
| 72091690 | India | 2026 | Carbon Steel – BF/BOF | 1.458 | 4.708 | € 262.92 | |
| 72091690 | Japan | 2026 | Carbon Steel – BF/BOF | 1.458 | 2.35719 | € 74.85 | |
| 72091690 | Serbia | 2026 | Carbon Steel – BF/BOF | 1.458 | 2.651 | € 98.36 | |
| 72091690 | South_Korea | 2026 | Carbon Steel – BF/BOF | 1.458 | 2.3584 | € 74.95 | |
| 72091690 | Taiwan_China | 2026 | Carbon Steel – BF/BOF | 1.458 | 2.5663 | € 91.58 | |
| 72091690 | Turkey | 2026 | Carbon Steel – BF/BOF | 1.458 | 2.761 | € 107.16 | |
| 72091690 | Ukraine | 2026 | Carbon Steel – BF/BOF | 1.458 | 2.797877632 | € 110.11 | |
| 72091690 | United_Kingdom | 2026 | Carbon Steel – BF/BOF | 1.458 | 2.75 | € 106.28 | |
| 72091690 | Vietnam | 2026 | Carbon Steel – BF/BOF | 1.458 | 2.607 | € 94.84 |
Table Source: McCloskey by OPIS © 2025 Oil Price Information Service, LLC. or © 2025 Dow Jones Energy Limited. All rights reserved.
Hot-dip Galvanized Coil (HDG)
| Steel Product | CN Code | Origin | Year | Default Prod. Route | Default BM (t CO2e/t) | Default Value (t CO2e/t) | CBAM cost (EUR/t) |
|---|---|---|---|---|---|---|---|
| HDG | 72104900 | China | 2026 | Carbon Steel – BF/BOF | 1.491 | 3.5255 | € 165.74 |
| 72104900 | India | 2026 | Carbon Steel – BF/BOF | 1.491 | 4.708 | € 260.34 | |
| 72104900 | Japan | 2026 | Carbon Steel – BF/BOF | 1.491 | 2.343 | € 71.14 | |
| 72104900 | South_Korea | 2026 | Carbon Steel – BF/BOF | 1.491 | 2.3584 | € 72.37 | |
| 72104900 | Taiwan_China | 2026 | Carbon Steel – BF/BOF | 1.491 | 2.5663 | € 89.01 | |
| 72104900 | Turkey | 2026 | Carbon Steel – BF/BOF | 1.491 | 2.761 | € 104.58 | |
| 72104900 | UAE | 2026 | Carbon Steel – BF/BOF | 1.491 | 4.51055 | € 244.55 | |
| 72104900 | United_Kingdom | 2026 | Carbon Steel – BF/BOF | 1.491 | 2.75 | € 103.70 | |
| 72104900 | Vietnam | 2026 | Carbon Steel – BF/BOF | 1.491 | 2.607 | € 92.26 |
Table Source: McCloskey by OPIS © 2025 Oil Price Information Service, LLC. or © 2025 Dow Jones Energy Limited. All rights reserved.
Reinforcing Bar (Rebar)
| Steel Product | CN Code | Origin | Year | Default Prod. Route | Default BM (t CO2e/t) | Default Value (t CO2e/t) | CBAM cost (EUR/t) |
|---|---|---|---|---|---|---|---|
| Rebar | 72142000 | Algeria | 2026 | Carbon Steel – BF/BOF | 1.364 | 3.3 | € 157.61 |
| 72142000 | China | 2026 | Carbon Steel – BF/BOF | 1.364 | 3.485663842 | € 172.46 | |
| 72142000 | Egypt | 2026 | Carbon Steel – BF/BOF | 1.364 | 4.395466384 | € 245.25 | |
| 72142000 | Turkey | 2026 | Carbon Steel – BF/BOF | 1.364 | 2.540638498 | € 96.86 | |
| 72142000 | Ukraine | 2026 | Carbon Steel – BF/BOF | 1.364 | 2.63723394 | € 104.59 |
Table Source: McCloskey by OPIS © 2025 Oil Price Information Service, LLC. or © 2025 Dow Jones Energy Limited. All rights reserved.
Wire Rod
| Steel Product | CN Code | Origin | Year | Default Prod. Route | Default BM (t CO2e/t) | Default Value (t CO2e/t) | CBAM cost (EUR/t) |
|---|---|---|---|---|---|---|---|
| Wire Rod | 72139149 | Indonesia | 2026 | Carbon Steel – BF/BOF | 1.364 | 9.053 | € 617.85 |
| 72139149 | Turkey | 2026 | Carbon Steel – BF/BOF | 1.364 | 2.540638498 | € 96.86 | |
| 72139149 | Ukraine | 2026 | Carbon Steel – BF/BOF | 1.364 | 2.63723394 | € 104.59 | |
| 72139149 | United_Kingdom | 2026 | Carbon Steel – BF/BOF | 1.364 | 2.541 | € 96.89 | |
| 72139149 | Vietnam | 2026 | Carbon Steel – BF/BOF | 1.364 | 2.585 | € 100.41 |
Table Source: McCloskey by OPIS © 2025 Oil Price Information Service, LLC. or © 2025 Dow Jones Energy Limited. All rights reserved.
Heavy Sections
| Steel Product | CN Code | Origin | Year | Default Prod. Route | Default BM (t CO2e/t) | Default Value (t CO2e/t) | CBAM cost (EUR/t) |
|---|---|---|---|---|---|---|---|
| Heavy Sections | 72163390 | China | 2026 | Carbon Steel – BF/BOF | 1.364 | 3.485663842 | € 172.46 |
| 72163390 | India | 2026 | Carbon Steel – BF/BOF | 1.364 | 4.697 | € 269.37 | |
| 72163390 | South_Korea | 2026 | Carbon Steel – BF/BOF | 1.364 | 2.330323809 | € 80.03 | |
| 72163390 | Turkey | 2026 | Carbon Steel – BF/BOF | 1.364 | 2.540638498 | € 96.86 | |
| 72163390 | United_Kingdom | 2026 | Carbon Steel – BF/BOF | 1.364 | 2.541 | € 96.89 |
Table Source: McCloskey by OPIS © 2025 Oil Price Information Service, LLC. or © 2025 Dow Jones Energy Limited. All rights reserved.
Stainless Flats
| Steel Product | CN Code | Origin | Year | Default Prod. Route | Default BM (t CO2e/t) | Default Value (t CO2e/t) | CBAM cost (EUR/t) |
|---|---|---|---|---|---|---|---|
| Stainless Flats | 72193410 | China | 2026 | No Split/Hybrid | 1.27 | 6.149 | € 392.86 |
| 72193410 | India | 2026 | No Split/Hybrid | 1.27 | 7.15 | € 472.94 | |
| 72193410 | Indonesia | 2026 | No Split/Hybrid | 1.27 | 9.559 | € 665.66 | |
| 72193410 | Malaysia | 2026 | No Split/Hybrid | 1.27 | 5.522 | € 342.70 | |
| 72193410 | South_Africa | 2026 | No Split/Hybrid | 1.27 | 4.279 | € 243.26 | |
| 72193410 | South_Korea | 2026 | No Split/Hybrid | 1.27 | 4.015 | € 222.14 | |
| 72193410 | Taiwan_China | 2026 | No Split/Hybrid | 1.27 | 5.522 | € 342.70 | |
| 72193410 | Thailand | 2026 | No Split/Hybrid | 1.27 | 5.5231 | € 342.79 | |
| 72193410 | Turkey | 2026 | No Split/Hybrid | 1.27 | 6.094 | € 388.46 | |
| 72193410 | Vietnam | 2026 | No Split/Hybrid | 1.27 | 5.522 | € 342.70 |
Table Source: McCloskey by OPIS © 2025 Oil Price Information Service, LLC. or © 2025 Dow Jones Energy Limited. All rights reserved.
Stainless Longs
| Steel Product | CN Code | Origin | Year | Default Prod. Route | Default BM (t CO2e/t) | Default Value (t CO2e/t) | CBAM cost (EUR/t) |
|---|---|---|---|---|---|---|---|
| Stainless Longs | 72222031 | Brazil | 2026 | No Split/Hybrid | 1.225 | 3.674 | € 198.37 |
| 72222031 | China | 2026 | No Split/Hybrid | 1.225 | 6.149 | € 396.37 | |
| 72222031 | India | 2026 | No Split/Hybrid | 1.225 | 7.128 | € 474.69 | |
| 72222031 | Taiwan_China | 2026 | No Split/Hybrid | 1.225 | 5.302 | € 328.61 | |
| 72222031 | Turkey | 2026 | No Split/Hybrid | 1.225 | 5.841 | € 371.73 | |
| 72222031 | United_Kingdom | 2026 | No Split/Hybrid | 1.225 | 3.421 | € 178.13 | |
| 72222031 | United_States | 2026 | No Split/Hybrid | 1.225 | 3.597 | € 192.21 |
Table Source: McCloskey by OPIS © 2025 Oil Price Information Service, LLC. or © 2025 Dow Jones Energy Limited. All rights reserved.
Articles of Iron and Steel
| Steel Product | CN Code | Origin | Year | Default Prod. Route | Default BM (t CO2e/t) | Default Value (t CO2e/t) | CBAM cost (EUR/t) |
|---|---|---|---|---|---|---|---|
| Sheet piling | 73011000 | China | 2026 | Carbon Steel – BF/BOF | 1.458 | 2.502217124 | € 86.45 |
| Rails of Iron/Steel | 73021022 | United_Kingdom | 2026 | Carbon Steel – BF/BOF | 1.383 | 3.091 | € 139.41 |
| Cast iron tubes/pipes | 73030010 | India | 2026 | No Split/Hybrid | 1.484 | 3.124 | € 134.17 |
| Seamless tubes/pipes | 73043982 | Ukraine | 2026 | Carbon Steel – BF/BOF | 1.383 | 2.85593 | € 120.60 |
| Welded tubes/pipes | 73053900 | Turkey | 2026 | Carbon Steel – BF/BOF | 1.458 | 2.4002 | € 78.29 |
| Welded tubes/pipes | 73066199 | Turkey | 2026 | Carbon Steel – BF/BOF | 1.491 | 2.46818 | € 81.16 |
| Flanges of iron/steel | 73079100 | China | 2026 | Carbon Steel – BF/BOF | 1.383 | 3.5772 | € 178.30 |
| Structures of iron/steel | 73089098 | China | 2026 | Carbon Steel – BF/BOF | 1.491 | 6.6385 | € 414.78 |
| Containers of iron/steel | 73090090 | China | 2026 | Carbon Steel – BF/BOF | 1.491 | 7.3205 | € 469.34 |
| Cans of iron/steel | 73102111 | United_Kingdom | 2026 | Carbon Steel – BF/BOF | 1.491 | 2.75 | € 103.70 |
| Screws and Bolts | 73181588 | China | 2026 | Carbon Steel – BF/BOF | 1.364 | 7.0125 | € 454.61 |
| Arts. Iron/Steel n.e.s | 73269098 | China | 2026 | Carbon Steel – BF/BOF | 1.491 | 3.3836 | € 154.39 |
Table Source: McCloskey by OPIS © 2025 Oil Price Information Service, LLC. or © 2025 Dow Jones Energy Limited. All rights reserved.
–Reporting by Benjamin Steven, bsteven@opisnet.com