
From Market Disruption to Pump Prices
Since the onset of the conflict with Iran on February 28, the U.S. economy has seen significant disruption, particularly within the energy sector. Retail fuel prices have moved sharply higher, affecting both consumer budgets and the operating environment for fuel retailers. For consumers, these increases can quickly translate into meaningful day-to-day cost changes. Based on average national unleaded gasoline prices, a 2025 Toyota Camry Hybrid getting about 50 miles per gallon would see fuel costs for a 30-mile round-trip work commute rise from roughly $1.80 before the war to about $2.40 during the week ending March 21st. A Ford F-150, on the other hand, which can average around 20 miles per gallon, would see an increase from approximately $4.50 per day to $5.70 per day.
While rapid increases at the pump can eventually influence demand and market share as drivers seek out cheaper fuel options, those downstream effects often take time to fully materialize. For that reason, next month’s RetailCents issue will focus on those changes, while this analysis prioritizes price increases at the national, regional, and state levels. All data discussed in this article corresponds with the associated charts that are available through the download link at the end of the piece.
Unleaded Gasoline Prices at the Spot Level
The OPIS Spot Ticker, which provides real-time refined product pricing data, tells much of the story behind the sharp increases seen at the pump. RBOB, CBOB, and CARBOB all followed a similar pattern: prices began climbing rapidly around the onset of the war with Iran on February 28. The period from March 9 through March 12 was particularly notable, as prices rose substantially in a matter of days. CBOB, for example, climbed to around $2.800 on March 12, up roughly 40 cents from its March 9 price.
As of this writing, prices have continued to fluctuate day to day, but the broader trend has remained upward. Periods of temporary stabilization have occurred, though they have largely served as short pauses between additional increases rather than signs of a sustained reversal.
Average National Unleaded Gasoline Price
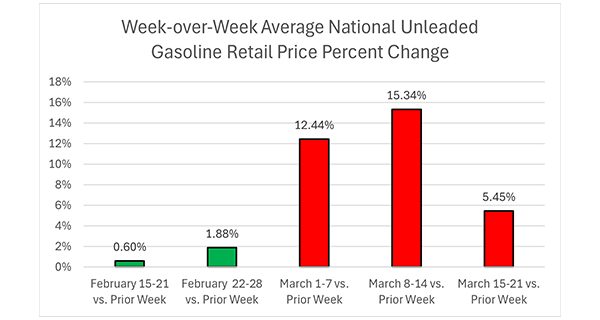
According to OPIS’ MarginPro, the average national unleaded gasoline retail price rose from $2.934 during the week of February 8-14 to $3.259 during March 1-7. It then climbed further to $3.868 by the week of March 15-21. Measured against the February 8-14 baseline, that represents an increase of $0.934 per gallon, or 31.83%.
This sharp rise highlights how quickly upstream market disruption translated into higher prices at the pump. In just over a month, the national average price moved from below $3.00 per gallon to nearly $3.90, placing meaningful added pressure on both consumers and retailers navigating a volatile pricing environment.
Average Regional Unleaded Gasoline Prices
Regional price patterns remained relatively consistent throughout the spike. In other words, while prices increased sharply across the board, the general ranking of less expensive and more expensive regions remained largely intact. For example, during the week of February 8-14, average regional unleaded prices ranged from $2.536 in the Midwest to $4.308 on the Pacific Coast. By the week of March 15-21, that range had shifted upward to $3.352 in the Midwest and $5.371 on the Pacific Coast.
Still, the regional data does show an important nuance. The Pacific Coast may have posted the largest absolute increase during the period, rising $1.063 per gallon, yet it recorded the smallest percentage increase at 24.68%. Meanwhile, every region outside the Pacific Coast and Northeast saw price upticks between 30% and 40%. This suggests an inverse relationship between dollar increases and percentage increases: regions with the highest starting prices often posted the smallest percentage changes, and vice versa.
Average State Unleaded Gasoline Prices
At the state level, average unleaded gasoline prices during February 8-14 ranged from $2.329 to $4.543. By the week of March 15-21, that range had moved much higher, from $3.232 to $5.630. California posted the highest average during the most recent week at $5.630, followed by Washington at $5.125, reinforcing the broader regional pattern of elevated prices in the western U.S.
However, like the regional level, percentage changes tell a somewhat different story. California and Washington posted increases of 23.93% and 25.31% respectively, which were not far above Pennsylvania’s 22.54%, the smallest percentage increase among all the states. Instead, some of the largest percentage gains were concentrated in the South. New Mexico recorded the steepest increase at 41.24%, followed closely by Kentucky at 40.42% and Tennessee at 40.30%. The state-level results show that while the highest absolute prices remained concentrated in the West, some of the most dramatic relative increases occurred elsewhere.
Diesel
Diesel prices largely followed the same broad pattern as unleaded gasoline, though at a higher overall price level. One key difference is that diesel posted, on average, larger percentage increases during the period analyzed. The national average diesel price increased by just over 40% between the weeks ending February 14 and March 21, while South Carolina recorded the largest state-level increase at 51.88%.
The diesel data reinforces the broader severity of the recent fuel market disruption. While the exact pricing levels differ from unleaded gasoline, the underlying trend was similar: sharp price escalation across the country, with certain states showing especially pronounced percentage increases. Like the unleaded gasoline data, diesel charts are available via the download below.
Taken together, the speed and scale of fuel price increases underscore how quickly geopolitical disruption can move from upstream to downstream markets. Although regional and state price patterns remained broadly consistent, the magnitude of the increases varied in meaningful ways, with some of the largest percentage jumps occurring outside the highest-price markets.
See national, regional, and state weekly spot, unleaded gasoline, and diesel changes.
Reporting by Ben Kaufmann, bkaufmann@opisnet.com