
The EU CBAM and What it Means for Latin American Exporters
The European Union’s Carbon Border Adjustment Mechanism (EU CBAM) is a groundbreaking initiative in global trade and climate policy. Essentially, it’s a tariff on the carbon emissions embedded in goods imported into the EU. Its main goal? To prevent “carbon leakage”—where companies might move production to countries with less strict climate policies—by ensuring a level playing field between EU producers, who operate under the EU Emissions Trading System (ETS), and their foreign competitors.
The CBAM started its transitional reporting phase in 2023 and will fully kick in by 2026, with payments becoming due in 2027. Initially, it will apply to imports of high-emission goods like iron and steel, aluminum, cement, fertilizers, electricity, and hydrogen.
Recent updates to the CBAM regulations include the “Omnibus I simplification package,” which exempts around 90% of importers bringing in less than 50 metric tons of CO₂ annually, while still covering 99% of emissions from the affected sectors. Changes also include replacing the €150 shipment value threshold with a carbon-based tonnage threshold and adjusting the pricing of CBAM certificates based on the quarterly average of 2026 EU Allowance (EUA) prices.
Challenges and Opportunities for Latin America
Implementing CBAM presents both regulatory and economic challenges, especially for countries without robust carbon pricing systems. For some, it will mean extra costs that could reduce their competitiveness in the EU market. However, for others, particularly those with lower-emission production processes, CBAM could offer a competitive edge and a chance to expand their market share in Europe.
To help understand these impacts, the World Bank introduced the CBAM Relative Exposure Index in 2023, which was updated on July 2, 2025, with a new framework called the CBAM Exposure Indexes. This framework includes four indicators:
- Trade Exposure Index (TEI): Measures excess carbon payments as a percentage of export value in a specific CBAM-covered sector.
- Aggregate Trade Exposure Index (ATEI): Reflects excess carbon payments as a percentage of total exports across all CBAM sectors.
- Output Exposure Index (OEI): Captures carbon costs as a share of sectoral gross output.
- Economic Exposure Index (EEI): Measures total excess carbon payments relative to a country’s GDP.
This analysis uses these indexes, focusing on three key variables, to assess CBAM’s impact on Latin American countries across different sectors:
- Carbon payment per dollar of production or imports: This is calculated by multiplying a country’s carbon emission intensity in a given sector by the EU carbon price. It indicates how much a country will pay for CBAM for each imported dollar of a specific good.
- Share of a country’s exports in a given sector destined for the EU market: This shows how dependent a country is on EU imports in that sector.
- Trade Exposure Index (TEI): This combines the first two variables to provide a comprehensive indicator of exposure.
Sector-Specific Impacts for Latin America
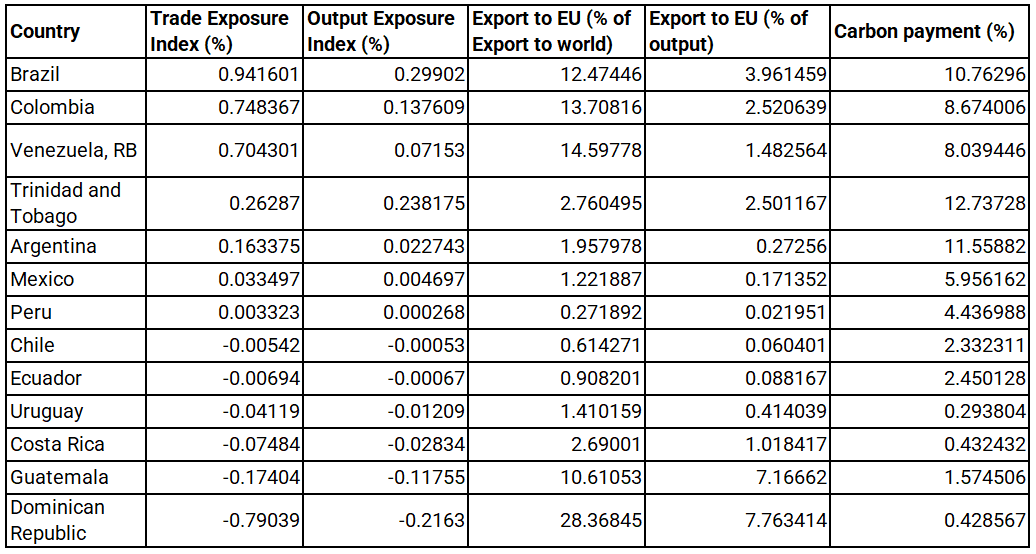
Iron and Steel
Latin America’s iron and steel sector faces significant CBAM exposure. Brazil is the most affected, with a TEI of 0.942. About 12.5% of its iron and steel exports go to the EU, and its carbon payment rate is 10.76% per dollar of imports—more than three times the EU average of 3.21%. Colombia follows with a TEI of 0.748, sending 12.3% of its exports to the EU with an 8.67% carbon payment per dollar. Venezuela is close behind, with a TEI of 0.704, 14.6% of exports to the EU, and an 8.03% carbon cost.
Countries like Trinidad and Tobago (TEI 0.262), Argentina (TEI 0.163), Mexico (TEI 0.033), and Peru (TEI 0.003) show more limited exposure due to lower trade volumes or more favorable emissions profiles, though they are still at a disadvantage. Trinidad and Tobago, despite only sending 2.7% of its total sector exports to the EU, has the highest carbon cost intensity in the region at 12.73%.
Conversely, Chile, Ecuador, Uruguay, Costa Rica, Guatemala, and the Dominican Republic have carbon costs lower than the EU average (3.21%), suggesting a potential competitive gain. The Dominican Republic stands out with a high share of exports to the EU (28%) and the lowest carbon cost intensity of 0.42% per dollar imported.
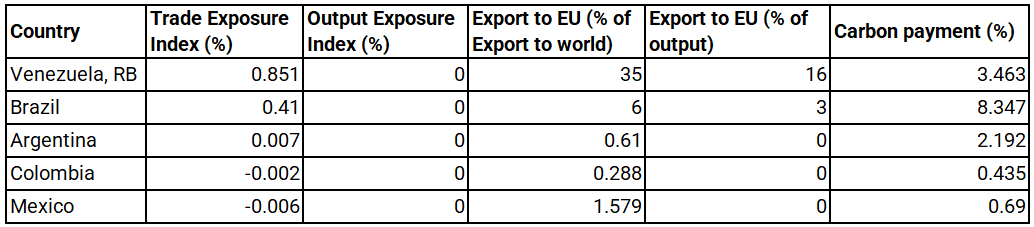
Aluminum
In the aluminum sector, Venezuela is the most exposed country, with a TEI of 0.851. 35% of its aluminum exports go to the EU, and its carbon cost reaches 3.46% per dollar. Brazil has a TEI of 0.410 and a carbon payment of 8.35%—eight times the EU average of 1.04%—even though only 6% of its aluminum exports go to the EU.
In contrast, Mexico and Colombia show significantly lower carbon payments per dollar than the EU (1.04%) and a negative trade exposure index, potentially benefiting from the CBAM tariff. Their low-carbon aluminum production could gain a competitive advantage over high-emissions EU trade partners like Mozambique, Kazakhstan, Indonesia, and Saudi Arabia, all of which exceed 8% in carbon payments per dollar.
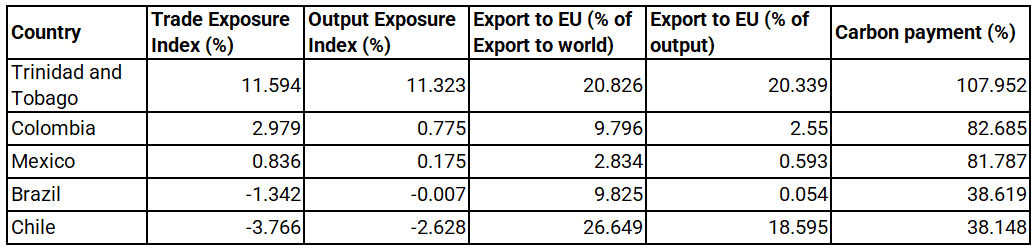
Fertilizers
For fertilizers, Trinidad and Tobago is the most exposed in the region, with a carbon cost intensity of 107.95%, far surpassing the EU average of 52%. Fertilizer exports to the EU make up 20.8% of the country’s sectoral exports and 20% of its domestic output, resulting in a TEI of 11.6. Colombia and Mexico follow, both with carbon payments over 81% per dollar and TEIs of 2.98 and 0.83, respectively.
Brazil and Chile present a more favorable situation. Chile, in particular, exports 26.6% of its fertilizer to the EU but has a carbon cost intensity of just 38%, lower than the EU average. This offers a strategic opportunity for market share gains, especially given the high emissions profiles of alternative EU suppliers like Indonesia (139%), the United Kingdom (73%), Egypt (93%), and Uzbekistan (86%).
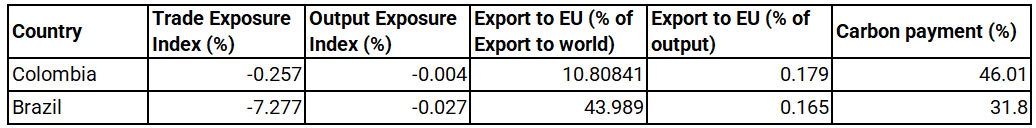
Cement
Latin American countries in the cement sector generally have a low carbon-intensive industry compared to other EU exporters. This suggests they could become more competitive in the European market, given their already high trade integration with the EU. Brazil is the most competitive in the region, with a carbon cost intensity of 31.8% and a high export share of cement to the EU at 43.9%. Colombia’s carbon cost intensity (46%) is slightly lower, still remaining below the EU sector average of 48%.
Overall, for most countries, the Economic Exposure Index (EEI)—which measures total excess carbon payments across all CBAM products as a share of a country’s GDP—is minimal (~0). However, Trinidad and Tobago stands out as the only country globally with an EEI of 2%, indicating a more significant impact on its economy.
Policy Implications
A key feature of the CBAM framework is its recognition of carbon pricing already paid in the exporting country. To avoid double carbon charges, importers can deduct the cost of a carbon tax or emissions trading system (ETS) implemented in the country of origin from the carbon tariff. This means countries with functioning carbon pricing mechanisms can partially shield their exporters from the full impact of CBAM.
However, Latin American countries generally lack strong carbon compliance markets. Mexico, Colombia, and Chile are the only jurisdictions with a carbon tax on industrial carbon emissions, while Brazil expects to fully implement its ETS by 2030. Recognizing the benefits of implementing compliance carbon pricing mechanisms to navigate new global carbon trade dynamics and drive decarbonization in the region is becoming increasingly urgent.
Beyond 2026
While Latin America’s overall trade exposure to the EU is relatively limited, some countries—especially Brazil, Venezuela, and Trinidad and Tobago—will face significant challenges once CBAM is fully operational. The mechanism is expected to expand by 2030 to cover all sectors included in the EU ETS, along with additional downstream goods and services. This broader scope could increase exposure for a wider range of Latin American exports.
Furthermore, if other major trading partners like the U.S. or Canada adopt similar border adjustment mechanisms, the economic risks for the region will grow substantially. In this context, robust decarbonization strategies and the development of effective carbon pricing systems are no longer optional. They are essential tools for transforming climate action into long-term competitiveness in global markets.